Armagh Magnetometer
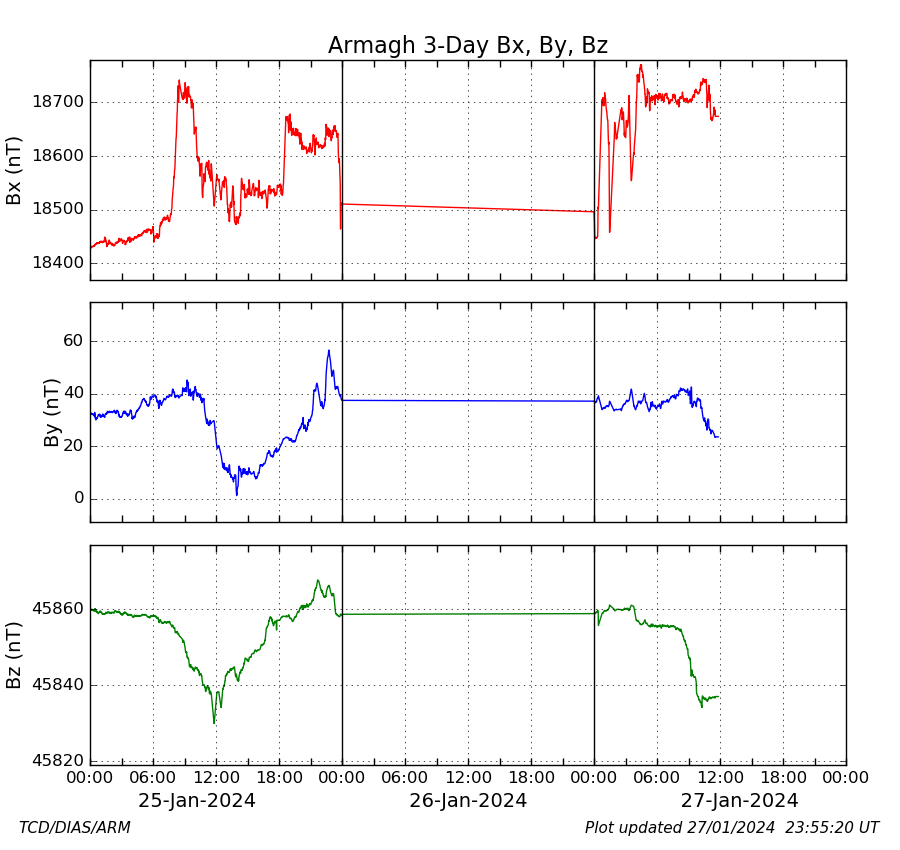

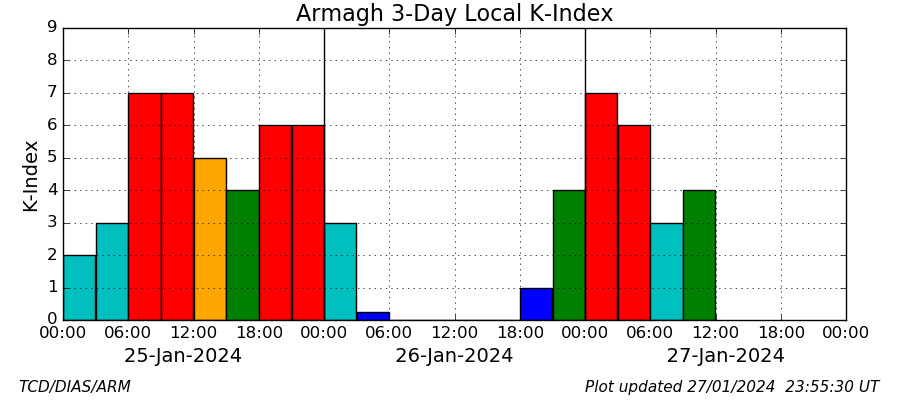
Above are plotted near-realtime magnetic field data from the DIAS/TCD magnetometer network. A local K-index for each site is also given below, which gives a measure of the disturbance of the geomagnetic field, and may be an indicator of auroral activity. The K-indices are calculated using the FMI method. Please visit the data archives to download plots and text data files. If you intend to use the data for scientific purposes, please acknowledge “Trinity College Dublin and the Dublin Institute for Advanced Studiesâ€.
Valentia Magnetometer


Above are plotted near-realtime magnetic field data from the DIAS/TCD magnetometer network. A local K-index for each site is also given below, which gives a measure of the disturbance of the geomagnetic field, and may be an indicator of auroral activity. The K-indices are calculated using the FMI method. Please visit the data archives to download plots and text data files. If you intend to use the data for scientific purposes, please acknowledge “Trinity College Dublin and the Dublin Institute for Advanced Studiesâ€.
3 Hour Aurora Forecast
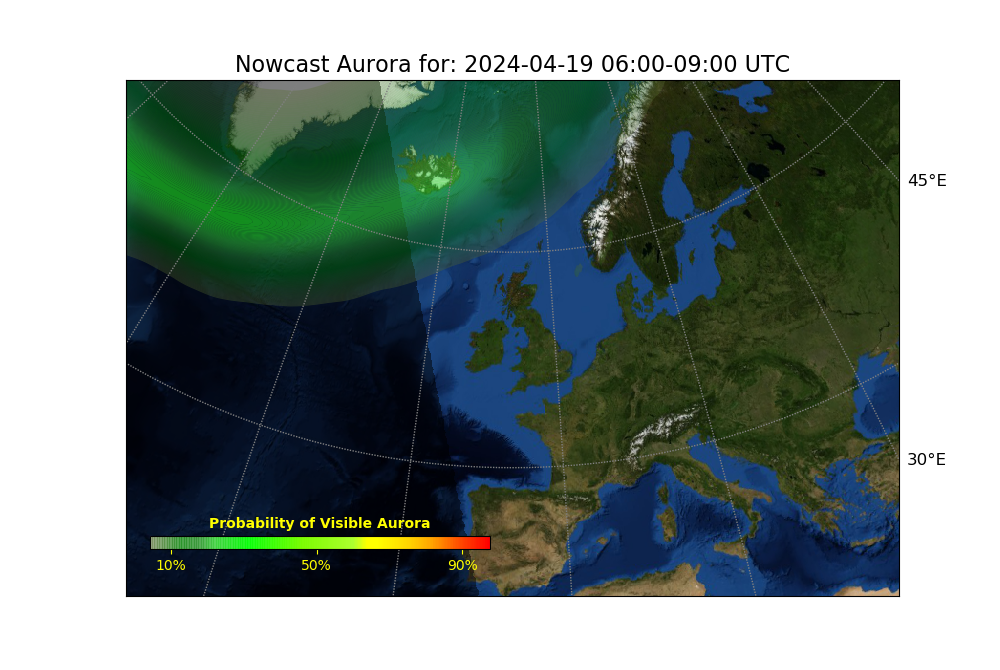
3 Day Aurora Forecast
The Aurora Forecasts (above) illustrates the probability of an aurora occurring within the next three hours/days. Green indicates low probability, while red indicates high. The Forecasts use the OVATION-Prime method, developed by NOAA/SWPC (Newell et al; 2009). This model was then adapted by the DIAS/TCD research group, in partnership with the UK Met Office. The model creates the probability maps by using a combination of solar wind and magnetometer data.
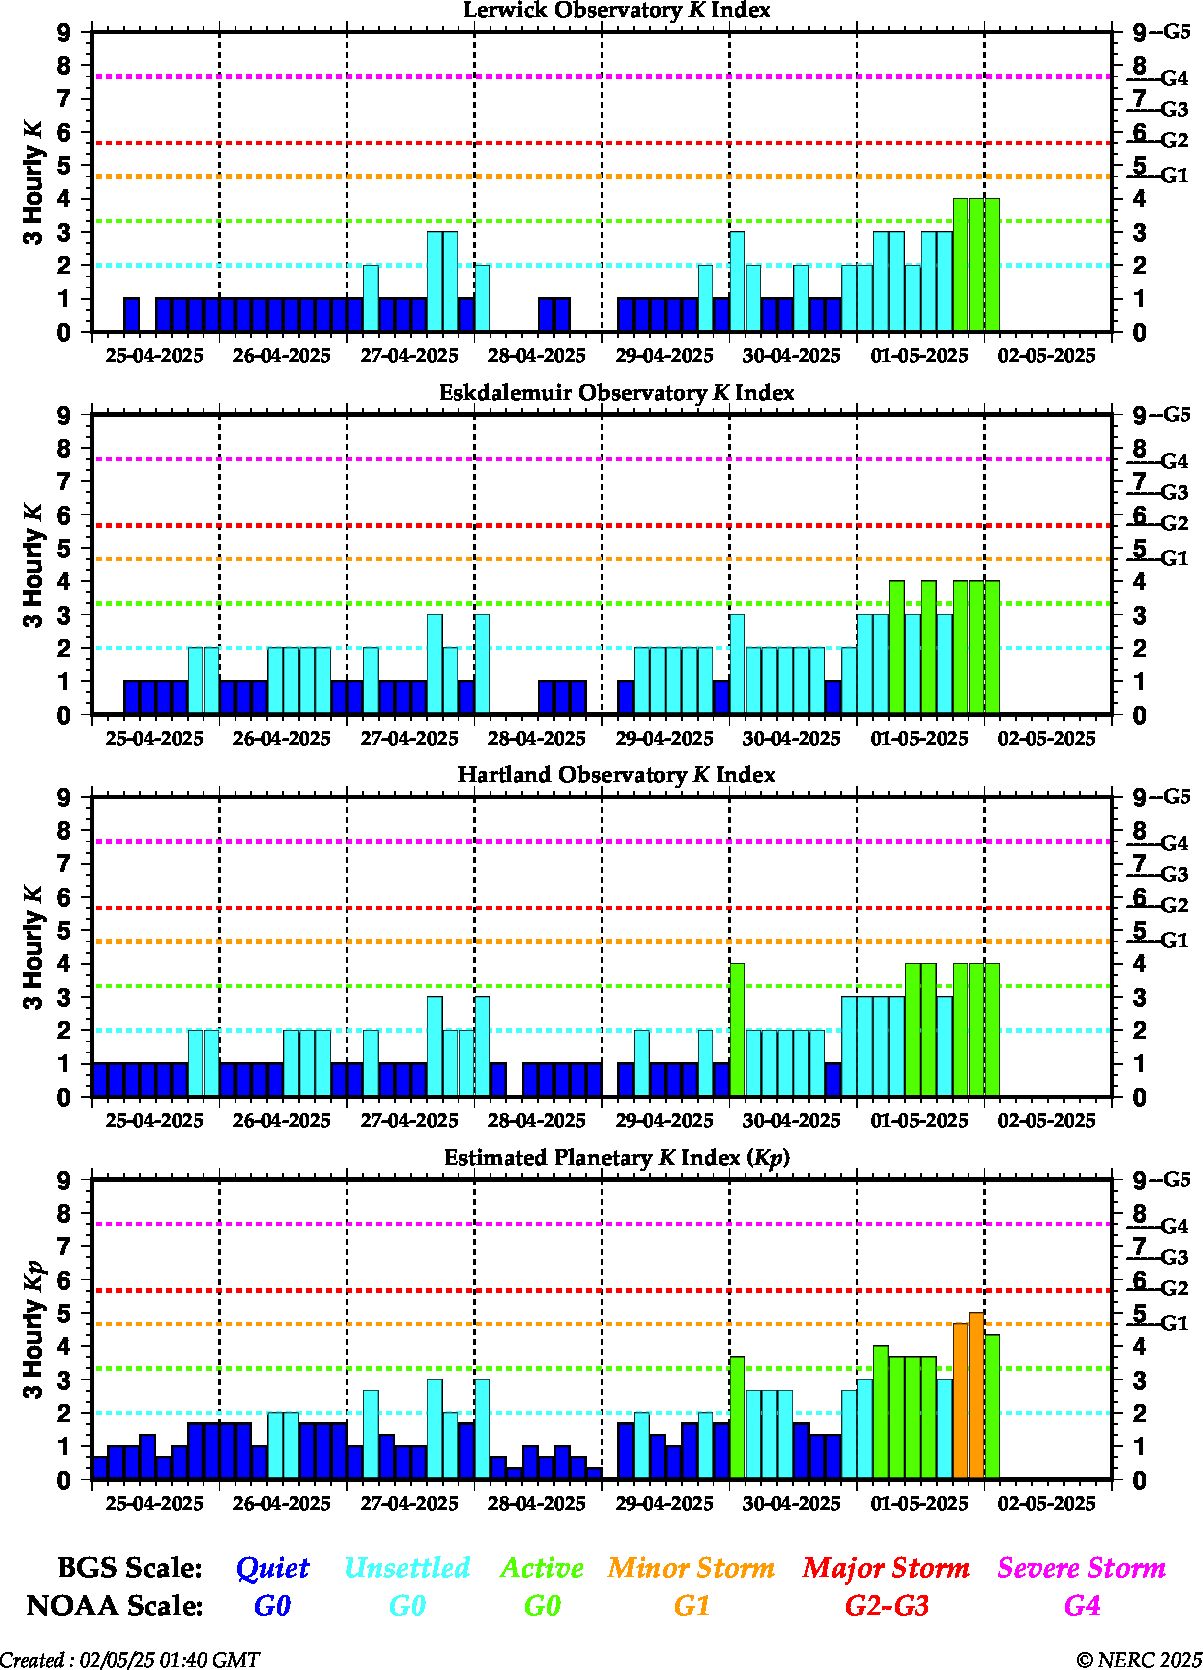
BGS Magnetometers
 Â
Â